(in the pouring rain, walking back and forth)
Little Ducks, there’s trouble in Russia. So they called us. We’re going over there and bringing the most lethal killing machine ever devised. Capable of launching more firepower than has ever been released in the history of war. For one purpose alone: to keep our country safe. We constitute the front line, and the last line, of defense. I expect, and demand, your very best. Anything less, you should’ve joined the Air Force (laughter). This might be our Commander In Chief’s Navy, but it’s my boat, and all I ask, is that you keep up with me, and if you can’t, then that strange sensation you’ll be feeling in the seat of your pants, will be my boot in your ass (laughter). (walks over to the podium, walks up the steps to the microphone)
Mr. Cobb?
Yes, Sir.
You’re aware of the name of this ship, aren’t you, Mr. Cobb?
Yes, Sir.
It bares a proud name, doesn’t it Mr. Cobb.
Yes, Sir, a very proud name.
It represents fine people.
Very fine people, Sir.
Who live in fine and outstanding states.
Outstanding, Sir.
in the greatest country in the entire world.
In the entire world, Sir.
And what is that name, Mr. Cobb.
Alabama, Sir.
And what do we say?
(together with Captain) Go, Bama, Roll Tide!
see to the boat, dismiss the crew!
Dismiss the crew, ay ay Sir. Crew, department heads, attend to your departments. Fall out!
Tuesday, July 29, 2008
Go Bama, Roll Tide!
Sunday, July 27, 2008
What About the Financials?


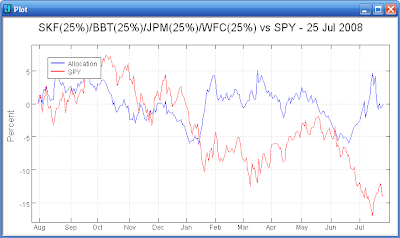
The financial sector has been extraordinarily weak over the past year. If you had anticipated the problems you could have offset some of the risk of the financial sector in your asset allocation. For example, the first plot above shows the equity curve for a 9% allocation to the Proshares Ultra Short Financials ETF (SKF) and a 91% allocation to SPY. The SKF would have approximately canceled out the financial sector from SPY. (SKF is a double short fund.)
If your asset allocation uses individual stocks, you might have attempted to identify a few of the stronger financial stocks one year ago. You could have purchased them and then also purchased SKF to offset the risk of a disaster in the financials. The second plot above shows the equity curve for an allocation consisting of 25% each of BBT, JPM, WFC, and SKF.
The double short sector funds allow the asset allocator to tune exposure to sectors without having to sell existing positions. The double short funds might be used in a short/intermediate term trading overlay as a complement to your long term allocation strategy.
Sunday, July 20, 2008
Historical Perspective


SPY is up three days in a row by a total of more than 4%. Looking at the entire history of SPY, the first table above shows the dates this setup occurred in the past and what happened 1, 2, 5, and 10 days later. There is a bias up for the 10 day holding period. It has an average return of 1.13%, a win rate of 59%, and an almost 2:1 win/loss ratio.
However, if we look at SPY since 2000 (see the second table above), we find no statistical edge for 1, 2 ,5, or 10 day holding periods. The 10 day holding period only returns an average 0.65%, a win rate of 50%, and a deteriorating win/loss ratio.
In summary, there does not seem to be an advantage to buying at this juncture with a 10 day or less perspective. On the other hand, there may well be an advantage if additional factors were to be considered. I shall work on expanding my testing to include volume, up/down trend, and the state of various indicators.
4 8 15 16 23 42
Tuesday, July 15, 2008
Covered Call ETFs?


What about covered call ETFs for a part of your asset allocation? The S&P 500 Covered Call Fund (BEP) and the Enhanced S&P 500 Call Fund (BEO) each attempt to replicate the CBOE S&P 500 Buy Write Index. Each fund yields about 15% and trades within a few percent of NAV. During big down moves like the current market they tend to under perform SPY, but can later move back to parity. (See the first plot above.)
Another way to go might be the Madison/Claymore Covered Call Fund (MCN). The fund is not an S&P Buy Write fund. It is a large cap stock covered call fund. It yields 14% and trades at about an 11% discount to NAV. It has substantially under performed SPY over the last year. (See the first plot above.) The discount could begin to shrink if the market can begin to recover.
Want more diversification? The Cohen and Steers Closed End Opportunity Fund (FOF) is a fund that buys other closed end funds. Approximately 25% of the fund is invested in covered call funds. FOF yields 10% and trades at a 3% discount. (See the second plot above.)
Monday, July 14, 2008
Roulette Anyone?


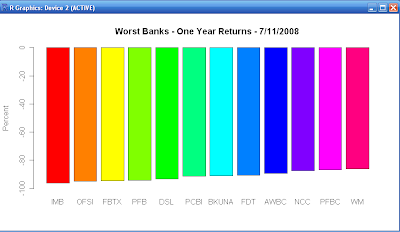
Yet another bad day for the banks... The IndyMac Bank (IMB) failure makes one think about which bank might be next. The plot above shows the return over the last year for the dozen worst banks. The most well known are Washington Mutual (WM) and National City (NCC) which were large losers today.
Be careful out there!
Saturday, July 12, 2008
Bank Failures
Monday, July 7, 2008
T2108 Crash


The T2108 indicator is now below 8%. It has not often been this low. The below 8% cases have tended to occur during major panics. See the plot and the list of dates above. Most of the instances occurred within two months of the Crash of 1987. Also note that T2108 first went below 8% on 10/16/1987, the Friday prior to Black Monday.
In summary, a major opportunity may be at hand, but it may be a rough ride.
Sunday, July 6, 2008
When To Take on the Red Knight

It is probably best not to take on the Red Knight until you have a been trained and have a thoroughly researched methodology. A portfolio of relatively uncorrelated methods is even better.
Dr. Brett points out in his recent SFO article that a lack of market understanding/effort/practice is the likely cause of trading problems and not emotions etc.
A key to overcoming resistance so you can get stuff done is to know your motivation. Are you really interested in being the best trader you can possibly be? Ot are you just interested in finding a get rich quick scheme?
Subscribe to:
Comments (Atom)

