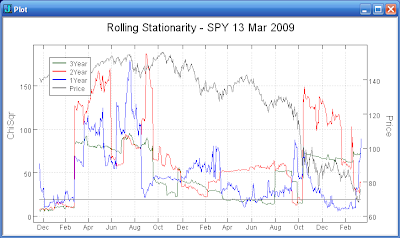
The market remains in a relatively unpredictable state. Various measures show the market has the potential for chaotic action.

The statistics for SPY for the past one, two, and three years are not stationary. The plot above shows the rolling stationarity for the three time periods. All periods are well above the threshold of 19 (gray horizontal line). Any of the patterns you see in the SPY over the periods indicated may merely be coincidental.

The SPY average true range (ATR) has been increasing over the past few weeks. See the plot above of the three week ATR for SPY. The ATR is far above the ranges seen in the years prior to the recent crash.
No comments:
Post a Comment