
What should be used as the triggering mechanism to take defensive action in your asset allocation plan or trading scheme? The 200 day moving average is a very simple and widely used way to signal that defensive action should be taken. (See the first plot above). On the move up from 2003-2007, the market made regular retreats below the 200 day moving average. If a more sophisticated criteria had been used, perhaps we could have recognized these retreats as normal pullbacks instead of potential crashes. (The slope of the 200 day moving average could be used as a signal to avoid such problems.)
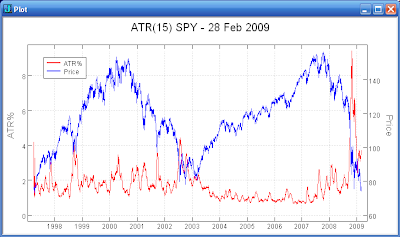
The average true range expressed as a percentage of the current closing price might be useful in detecting abnormal market conditions. (See the second plot above.) In particular, the low volatility from 2003-2007 signaled that the pullbacks were not the beginnings of a market crash. The increasing ATR levels in 2007 and 2008 foreshadowed the crash at the end of 2008. The extreme ATR levels have currently backed off to the quite high levels reached during the 2000-2003 bear market. Is the high volatility a sign that it is still too early to be considering long term buys?
No comments:
Post a Comment