The Dividend Aristocrats have not really exhibited much advantage over the S&P 500 (SPY) recently. Take a look at the plot above which shows the performance of SPY and the Dividend Aristocrats over the past year. Back in September 2008 the Aristocrats began to outperform SPY, but they have not been able to increase their advantage over the past several months.
Sunday, March 29, 2009
Dividend Aristocrats Again
The Dividend Aristocrats have not really exhibited much advantage over the S&P 500 (SPY) recently. Take a look at the plot above which shows the performance of SPY and the Dividend Aristocrats over the past year. Back in September 2008 the Aristocrats began to outperform SPY, but they have not been able to increase their advantage over the past several months.
Saturday, March 28, 2009
Asset Class Rotation With Filter
The simple asset rotation scheme previously described, has taken a beating during the recent market crash. The asset classes used were US Stocks, foreign stocks, US REITS, US Bonds, and commodities. The plot above shows that the monthly rotation scheme outperformed SPY, but was not any better during the high speed crash late in 2008.
The performance of the basic top 3 of 5 asset classes scheme is substantially improved with the addition of a filter to avoid taking positions if the asset class is below its 200 day moving average. Take a look at the plot immediately above. Although the filtered rotation approach will lag if the market continues straight up to its 200 day moving average, the avoidance of large losses is also an important consideration.
Monday, March 23, 2009
What Happens After SPY is Up Big
Sunday, March 22, 2009
Update: Market Neutral
After a recent pullback, QQQQ may still be able to outperform SPY. A market neutral position may still be worth while.
SLV spiked down and recovered this past week. It may continue to outperform GLD.
Tuesday, March 17, 2009
A Silver Lining?

Is silver relatively under priced? Take a look at the plot above which shows the ratio (red line) of silver (SLV) to gold (GLD). Silver and gold moved together during the first half of 2008 and then silver underperformed during the second half of 2008. Silver has been outperforming gold so far in 2009. Can silver continue to take the lead?
Sunday, March 15, 2009
Market Chaos

The market remains in a relatively unpredictable state. Various measures show the market has the potential for chaotic action.
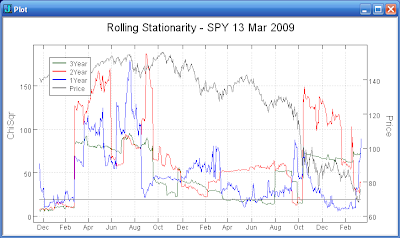
The statistics for SPY for the past one, two, and three years are not stationary. The plot above shows the rolling stationarity for the three time periods. All periods are well above the threshold of 19 (gray horizontal line). Any of the patterns you see in the SPY over the periods indicated may merely be coincidental.
The SPY average true range (ATR) has been increasing over the past few weeks. See the plot above of the three week ATR for SPY. The ATR is far above the ranges seen in the years prior to the recent crash.
Which Way?

The market is now setup for a pullback. Will it just be a pause in the move up, or will the market collapse as it has done so many times in recent history? Should long positions be sold? Should a hedge be established to protect longs? Is a short position worth establishing here?
Or perhaps if there is still too much uncertainty about market direction, we should go with a market neutral position. The long QQQQ/short SPY position has done very well during 2009 and is beginning to pullback a bit. The technology stocks will likely outperform the SP-500 during another collapse, especially if the financial stocks lead the way lower. If the market continues to move higher, technology may still be relatively better than the SP-500.
Saturday, March 7, 2009
Tuesday, March 3, 2009
Market Neutral Position
One approach to trading the market without taking on large risk is to establish a position that is market neutral. For example, the spread plot above shows the ratio of QQQQ to SPY (red line). QQQQ and SPY are significantly correlated most of the time so we have a somewhat market neutral position if we buy QQQQ and short SPY. (In the event of a market crash we should not lose too much.) The spread plot shows that the QQQQ/SPY ratio bottomed out in December 2008, and QQQQ has been significantly been outperforming SPY thus far in 2009. Take a look at the second plot above. SPY is down about 22% this year while QQQQ is only down 10%. We could have made 12% so far this year by buying QQQQ and shorting SPY. Not as good as making 22% just shorting SPY, but we could have made the 12% without being fully exposed to the risk of a market meltdown or melt-up.
Monday, March 2, 2009
Sunday, March 1, 2009
T2108 Oversold again
The TeleChart T2108 indicator is oversold once again. Last week it moved below 10%. The red line in the plot above shows the times since 1987 when T2108 has been at or below 10%. These points have generally been good big picture buying opportunities. However, sometimes it can be a rough ride as during the 2002 bottom.
The current market crash is an example of a very rough ride. (See the plot above.) The market began a recovery at the end of 2008, but has now retreated to below the crash lows and T2108 has again moved to very low levels. The 1987 crash is the only other instance of extremely low T2108 values persisting over a multi-month period.
However, the 1987 bottom was much better behaved. (See the plot above.) T2108 went to extremely low levels in October 1987 and then chopped back and forth until December 1987 when a recovery began.
Subscribe to:
Posts (Atom)