Saturday, January 31, 2009

Dividend Aristocrats or Dividend Duds?


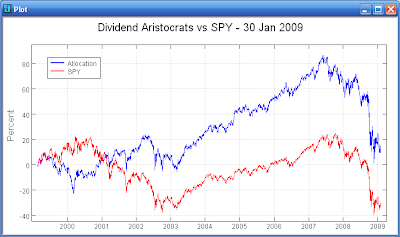
The Dividend Aristocrats are maintaining a small advantage over the S&P 500, but the defensive stocks have certainly not done well the past couple of years. Take a look at the first plot above which compares SPY to the Dividend Aristocrats.

The Low Beta/Low R-squared type of stocks have not out performed the general market in the current bear market. The second plot above shows the massive out performance of the Dividend Aristocrats in the 2000-2003 bear market. The destruction of the financial stocks has made this bear market quite different than the prior bear market.

Wednesday, January 28, 2009

Big Market Gap Up Openings


The SPY is gaping up 2% this morning. The plot above shows the results for buying the SPY at the open and holding until the end of the day and holding until the close of the following one, two, and five days. There does not appear to be any edge based on the 2% gap up. The average return is negative for all of the tested time periods. None of the results are statistically significant. However, note that the prior four trades during late 2008 were profitable when buying the gap up open and holding until the close.

Sunday, January 25, 2009

Stock selection


'Invest by Knowing What Stocks to Buy and What Stocks to Sell' looks like a very valuable book. Price relative strength and price/sales ratio are the key factors for stock selection.

A detailed review of the book is here.

The Kirkpatrick site with an update of the forward testing of the 'Bargain List' is here.

Saturday, January 24, 2009

International Update


Chile (CH) was the best performing country index ETF for the past month. (The chart above shows the one month return for various country ETFs.) Chile went from near the bottom of the list in the last update to the top of the list this past month. Russia (RSX) maintained its position in last place with a 20% loss. Ireland (IRL), which has done very badly during the market crash, now appears near the top of the rankings. The US market (SPY) is now in the upper third of the rankings.

Tuesday, January 20, 2009

Update: Thanksgiving Trade


The Thanksgiving Trade was exited today. If not for the inauguration day wipe out, it would have made a small profit. The trade lost about 1% for 2008. A plot of the return for each of the last 21 years is included above.

Sunday, January 18, 2009

Any Interest in Interest?


Is there any safe way to receive a reasonable interest rate on the bond portion of your portfolio?

High quality corporate bonds (LQD) and municipal bonds (MUB) have recovered from the market crash. (See the plot above.) Corporate junk bonds (COY) have made a nice move up off of the bottom, but are still down substantially. Long term treasuries (TLT) have been the big winner during the market crash, but will plummet at some point. Inflation protected treasuries (TIP) are up a bit from their crash lows, but there is no inflation panic yet.

Sunday, January 11, 2009

3x2 Method and IBD-100


Using the 3x2 method with the IBD-100 stocks could be a significantly profitable approach! Take a look at the equity curve included above. The 3x2 method was tested using this weeks IBD-100 stocks that have a history of a least two years (93 stocks). I realize that the IBD-100 list changes each week, but it has some similarity week to week. In particular, take a look at the spectacular performance in the last two months where the lists may have been close in composition to this weeks list.

Further investigation is needed to determine how stable the IBD-100 list is over time. Should N consecutive IBD-100 lists be combined into a single trade-able stock list? How long should a stock be retained on the trade-able list?

How can the list be filtered to reduce the number of trades? Currently the method would be making too many trades for the amount of money I have available. The IBD-100 also contains many small capitalization and low volume stocks. When using the 3x2 method with the NASDAQ-100 stocks, I use a filtered list of the top 20 stocks to hold down the number of trades and increase the average return. The NASDAQ-100 stocks list is more stable than the IBD-100 stocks list so a filtering scheme may have to be different to work with the IBD-100 list.

Saturday, January 10, 2009

Simple 3/10 Oscillator Method


Even very simple schemes like the 3/10 oscillator can capture the markets tendency to go to short term extremes. In the past year, the 3/10 oscillator method has captured several nice trades. See the equity curve above for SPY for the last four years.

The method buys when the 3/10 oscillator has gone down five or more days in a row and the close of the day is above the opening of that day. The position is then held for five days. (More elaborate exits may improve performance.) The method sells when the oscillator has gone up five days in a row and the close of the day is below the opening of that day. The 3/10 oscillator is just the difference between the 3 day simple moving average and the 10 day simple moving average.

While the method may not be suitable as a stand alone trading system, it does capture the market's tendency to overshoot. An exit after two favorable days or an exit after some movement of the oscillator will be investigated as possible improvements. Perhaps a more adaptive determination of extremes will yield a reliable core scheme for a trading system.

Sunday, January 4, 2009

January Shows the Way?


Does the January return really show us the direction of the market for the rest of the year? The plot above shows the return for January and the return for February-December for each of the last 20 years for SPY. January and February-December only went in the same direction 15 out of 20 years. Three of the misses occurred recently. See 2001, 2003, and 2005. Note that 2001 and 2003 were big misses.

Saturday, January 3, 2009

Crystal Ball


What do we actually know about the market in the coming year?

We do know expert predictions are never of much value. From CXO Advisory (Jan 2): "In summary, investors should not expect the typical "expert" to outperform a simple extrapolation of the long-term trend in forecasting the level of a broad stock market index one year ahead."

Another thing we know is that earnings estimates continue to go lower. The forward and trailing market P/E ratios are not as low as you might hope after a crash.

Thursday, January 1, 2009

2009


Well... I failed to complete the Device in 2008. 2009 will likely be volatile and choppy with many opportunities for short term trading. I absolutely will complete my short term trading Device this year!!!


Perhaps a big picture doomsday deadline is what I need? Perhaps this will force me to finish everything in preparation for the end?

o What about 2012? There are many 2012 warnings.

o The Horizon may be another 2012 doomsday scheme?

o What about the Bilderberg Group and its endgame conspiracy? (This organization/conspiracy is very similar to Prophet Five in the fifth season of Alias.)

<o>