
Over the past year (250 days), the SPY has had an average daily return of -0.03% with a standard deviation of 1.05%. If you randomly select 250 samples from a normal distribution with the same parameters, the resulting equity curve will have an appearance very similar to the actual SPY curve. The first plot above shows an example of a randomly generated curve and the actual SPY curve.
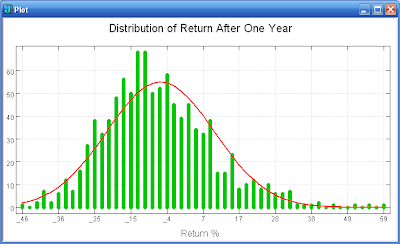
If we run the experiment many times we can get some perspective on the possible return after one year of drawing samples from this distribution. The second plot above shows a histogram of the results obtained from running the experiment 1000 times. The mean return is -6.9% with a standard deviation of 15.9%. The range of returns shows that the SPY easily could have done much better or worst than the actual one year return of about -7.5%.
In summary, the randomness content of stock data seems to be high. The surges in the randomly generated data are of the same magnitude as the recent SPY price plunge. It is probably not a good idea to read too much into many of the market's fluctuations. The range of return from a series of samples taken from the same distribution can vary widely. The market's return each year will tend to vary significantly from what your model predicts.
No comments:
Post a Comment