Sunday, December 30, 2007

Dividend Aristocrats


Are the large stable 'boring' stocks the way to go? The SP-500 Dividend Aristocrats have increased their dividends each year for at least the last 25 years.

The first plot above shows the equity curve for the current batch of Dividend Aristocrats versus SPY for the last eight years. The Aristocrats significantly lagged during the tech surge of 1999-2000, but substantially outperformed during the tech collapse of 2000-2002. From 2003-2007, the Aristocrats have kept pace with SPY. However, the Aristocrats have been lagging SPY for the last 9 months. See the second plot above which covers the last three years. The financial sector Aristocrats have been faltering during this period.

For long term purposes, the Aristocrats would seem to be good choices for your large capitalization stock allocation. They also tend to have modest correlation to the SP-500 as a whole and can provide some diversity to your portfolio.

You can find an Excel spreadsheet listing the September 2007 members of the Dividend Aristocrats in the 12/28/2007 post at CrossingWallStreet.com.

Thursday, December 27, 2007

Holy Grail


Is the search for the 'Holy Grail' trading method of benefit to the trader? If the trader enjoys the journey and is able to utilize the imperfect methods found during the quest, then it can be of immense value. The trader's success depends on becoming comfortable with taking the calculated risk implied by the imperfect methods. The quest for the grail can provide the trader with the impetus to continuously improve his methods and market understanding.

From 'The Alchemist' by Paulo Coelho:

"Why are you called the alchemist?"
"Because that's what I am."
"And what went wrong when other alchemists tried to make gold and were unable to do so?"
"They were looking only for the gold", his companion answered. "They were seeking the treasure of their Personal Legend, without wanting actually to live out the Personal Legend."

Sunday, December 23, 2007

Secret to Success


The article, 'The Secret to Raising Smart Kids', in the most recent issue of 'Scientific American Mind', makes a very important point about success.

Summary points from the article:
"Many people assume that superior intelligence or ability is a key to success. But more than three decades of research shows that an overemphasis on intellect or talent—and the implication that such traits are innate and fixed—leaves people vulnerable to failure, fearful of challenges and unmotivated to learn.

Teaching people to have a “growth mind-set,” which encourages a focus on effort rather than on intelligence or talent, produces high achievers in school and in life.

Parents and teachers can engender a growth mind-set in children by praising them for their effort or persistence (rather than for their intelligence), by telling success stories that emphasize hard work and love of learning, and by teaching them about the brain as a learning machine."

This is certainly a lesson for us all, especially in the area of trading. Effort, persistence, and a love of learning are what is needed and not reliance on some magical insight. Existence exists.

Saturday, December 22, 2007

Complete Opposite


The end of the year is a good time to consider what you have been doing in the past year and what you would like to be doing in the coming year. Are there any areas in which you should be doing the complete opposite? Should you try something new? Should you be doing the same thing, but in a different way?

"This is no longer just some crazy notion, this is my religion."
   -- George Costanza

Monday, December 17, 2007

Market Inferno - Rebalance?


The market has been in 'Towering Inferno' mode the past several weeks. How do you adjust your asset allocation for long term accounts? For example, US Small Capitalization (IWM) has been significantly under performing US Large Capitalization (SPY). This is illustrated by IWM versus SPY in the first plot above.

Do you increase the allocation to small capitalization at this time to bring it back into alignment with your allocation plan? In the long term, IWM will outperform SPY. See the second plot above which shows IWM versus SPY for the last seven years. IWM will substantially underperform during market pullbacks, but it will outperform as the market recovers. During the big down market from 2000 through 2002, IWM still managed to outperform SPY. IWM has lagged quite a bit since August so we may be approaching a reasonable area in which to add to the small capitalization allocation.

One approach for rebalancing long term accounts is to accumulate new money in a money fund and then deploy the money to other asset classes when a trigger condition is hit. For example, the T2108 indicator (or your personal favorite) might be used to mark an oversold zone in which you would rebalance the account to your desired allocations.

Saturday, December 15, 2007

Magazine Cover Indicator


Does the magazine cover indicator work? For example, two weeks ago the Economist cover (December 1st) featured the falling US dollar. The cover was published at about the time dollar was bottoming (at least for the short term). A chart of the US Dollar Index is included above.

Is there any published information on the reliability of taking the opposite position implied by news magazine covers? By the time a trend becomes so widely recognized that it appears as the cover topic of a news magazine, most everybody must already be on board the reported trend.

Tuesday, December 11, 2007

I Can't Get No Satisfaction


Well... Today the Fed disappointed the market and the market fell off a cliff. I have been attempting to maintain a longer term perspective, but I may have to go back to more active short term trading. The satisfaction from longer term trading has just not been there recently.

On the bright side, the sell off represents a short term opportunity. After SPY has gone down 2% or more in one day, 70% of the time it is up after 5 days with an average return of 2%. The table above summarizes the results for SPY after 1, 2, and 5 days. The results are based on the last five years of daily SPY data.

Sunday, December 9, 2007

What Happened to the Dividend ETFs?


What has happened to the dividend ETFs recently? Take DVY as an example. Since mid year it has massively underperformed SPY. The first image above shows DVY and SPY for the last three years. I looked up DVY at ETFConnect and found that DVY has a 38% weighting in the financial sector. The SPY only has about an 18% weighting. That is how a 'conservative' dividend fund can have surprisingly bad performance. The second image above shows SPY and XLF (financial sector) for the last three years.

The moral of the story is to be aware of the composition of ETFs and the indicies that they are based on. You may not be getting the exposure or diversification that you bargained on.

Saturday, December 8, 2007

Hindenburg Mystery


I believe the most recent Hindenburg Omen occurred back in mid October. The Dow is now above its level of mid October, so I assume that the Omen has been closed out. The definition and history of the Hindenburg Omen can be found at SafeHaven.com. (I could not find a post with the history updated after 2005.)

Does the Hindenburg Omen indicator actually work? Is the indicator just a curve fit curiosity? Some of the declines after the Omen are quite small and are likely just the normal market variability. A more detailed look at market conditions at the Omen times would be needed to decide if the indicator actually seems to track market crash potential.

For long term accounts, it probably does not make sense to take any action based on something like the Omen. In fact, the 1937 Zeppelin disaster can provide us with big picture perspective about bailing out prematurely.

From wikipedia.org:
" Despite the violent fire, most of the crew and passengers survived. Of the 36 passengers and 61 crew, 13 passengers and 22 crew died. Also killed was one member of the ground crew, Navy Linesman Allen Hagaman. The two dogs on board the ship also died. Most deaths were not caused directly by the fire but were from jumping from the burning ship. Those passengers who rode the ship on its descent to the ground survived. "

Sunday, December 2, 2007

Gotta Have More Crabel


'Day Trading With Short Term Price Patterns & Opening Range Breakout' by Toby Crabel describes many interesting patterns and illustrates his approach to market research. For example, the 'Open to Close' pattern shown in the table above.

The table shows the open to close bias for the QQQQs based on the three prior days' closes and the current day's opening. Whether the three prior days closed up or down is shown by the first three '+' or '-' signs in the Pattern column. The final '+' or '-' shows whether the current day's open is up or down. The Mean column shows the average percent profit entering at the open and exiting at the close. The Buy column contains '1' for a buy and a '0' for a sell. The statistically significant patterns are in red.

Knowledge of such patterns can help you to determine the up or down bias for the day. Applying such patterns to individual stocks will reveal larger percentage biases that might be tradable in isolation. The above pattern combined with other information could form the basis for a short term trading system. I will be reexamining the Crabel approach and will post further on this topic in the future.

Tuesday, November 27, 2007

Lobotomy


Well... has the market sustained enough damage to worry you? Is this an opportune time to buy some of the destroyed sectors for the long term? Are you so worried about potential problems that a lobotomy will be required for you to buy? Have you lost faith in short/intermediate term rallies?

Guess I've got to break the news, that I got no mind to lose.

Sunday, November 25, 2007

Don't Wanna Be a Pinhead No More


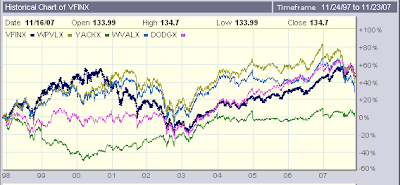
Is this the time to consider buying value? A recent article about buying value funds while they are down makes a good point. This type of fund has the capability to move independently of the market. Take a look at the chart included above. The value funds mentioned in the article (WPVLX, YACKX, WVALX, and DODGX) have sometimes significantly zigged while the market (VFINX) has zagged.

Gabba Gabba Hey

Tuesday, November 20, 2007

Big Picture Outlook


Speaking of the Telechart T2108 indicator...
The T2108 indicator shows the percentage of stocks above their 40 day moving average. When it is below 20% it tends to mark big picture buying opportunities. Take a look at the plot above. The red lines indicate when the T2108 was less than 20%. These times have mostly been good times to buy for the long term. There have been exceptions, such as in late 2001 when the market continued to drop substantially for another year. So as always, caution and reasonable expectations are advised.

Monday, November 19, 2007

The Thanksgiving Trade


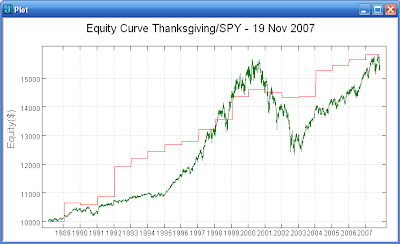
The 'Thanksgiving Trade' has been quite reliable over the years. The trade buys prior to Thanksgiving and sells the third week of January. Over the 19 year history of the SPY, the trade has been a winner 84% of the time with an average return of 3%. The equity curve for the trade and a bar chart of the return for each year is included above.

Will the trade produce a cornucopia of profits this year or will it prove to be a loser like in 2001 and 2002? Even when the trade has been a loser, the losses have been small resulting in a win/loss ratio of 3.5.

Sunday, November 18, 2007

January Effect


January is fast approaching which brings up the question of whether the 'January Effect' exists in recent market history. Do the small capitalization stocks outperform large capitalization stocks during January?

In the last 16 years, the Russell-2000 has been up 81% of the time during January returning an average of 2.5%. The three losing years were 2002, 2003, and 2005. The SP-500, in the last 16 years, has only been up 69% of the time in January and returned an average of 1.2%. The five losing years were 1992, 2000, 2002, 2003, and 2005. The equity curves are shown above.

Can we conclude anything from the above? The results for Russell-2000 vs. SP-500 are not statistically significant. As you can see from the bar chart above, the difference between RUT-X returns and SP-500 returns has not been consistently positive. Examining additional data may show the difference to be significant, but recent history does not seem to show a small capitalization bias.

The results could very well be much different if I had tested with a micro-cap index instead of the small-cap Russell-2000 index. I do not not enough micro-cap data to do any testing. I will have to attempt to find a micro-cap vs. large-cap study for recent years.

Monday, November 12, 2007

Oh the Humanity!


Does the market look bad enough to buy for a short term trade? The VIX is extended to the upside. The beaten down financials attempted a rally today. The unstoppable momentum stocks like AAPL, RIMM, PCU, BHP, and FXI have been stopped.

Is there a short term edge to buying after a decline? The SPY is down four days in a row today. That has only happened 103 times in the 19 year history of SPY. Buying SPY after it has been down four days in a row and holding for five days has returned 1.29% on average. The results for holding one, two, and five days are summarized in the table above.

In 2007, there have been two other instances of SPY being down four days in a row. Holding SPY for five days after 9/25 yielded 1.8%. However, holding SPY for five days after 2/26 resulted in a loss of 5.4%. So even though the bias is to the upside, caution is advised.

Sunday, November 11, 2007

Arugamama


Procrastination is definitely an item I need to work on. The Japanese use the term arugamama to describe the state of "accepting things as they are." This can be the key to overcoming procrastination. Gregg Krech of the ToDo Institute describes the use of Morita Therapy as a resource to overcome procrastination.

One of the key tenets of Morita Therapy is that our thoughts and feelings are uncontrollable by our will. The reasons for procrastination have to do with internal barriers like fear, anxiety, indecision, and perfectionism. The best strategy for coping with fear is to accept it. Don't try to fight it, understand it, or conquer it. And the way to master this strategy for coping with fear is to practice.

"Give up on yourself. Begin taking action now, while being neurotic or imperfect, or a procrastinator or unhealthy or lazy or any other label by which you inaccurately describe yourself. Go ahead and be the best imperfect person you can be and get started on those things you want to accomplish before you die."
   - Shoma Morita, M.D.


The video above is Noriyuki "Pat" Morita as Mr. Miyagi in the Karate Kid movies.

Thursday, November 8, 2007

Money For Nothing


That ain't working
That's the way you do it
Money for nothing
And your chicks for free
   -- Dire Straits


Are you still convinced that trading is the way to go? Has the market been volatile enough for you? Is the study and analysis of the market still interesting?

Trading must not be work if you are really going to commit the needed time and effort.

Sunday, November 4, 2007

Sector Rotation Again


In my prior 'Sector Rotation' post, I described a method that buys the three lowest relative strength Select SPDRs. The equity curve for this approach is shown in the first plot above. The method substantially out performs SPY especially during the big down market of 2000 to 2003.

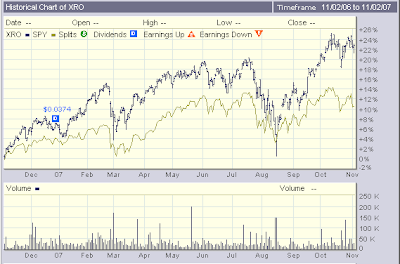
In the prior post I also mentioned the Claymore/Zacks Sector Rotation ETF (XRO). I have since located the fact sheet for XRO. This ETF is based on a proprietary Zacks methodology that selects 100 of the 1000 largest domestic companies/ADRs to hold for the next quarter. The selection process is then repeated each quarter. The fact sheet contains a graph of the index on which XRO is based. The performance of this index looks very similar to the performance I show for my sector rotation method. In particular, the Zacks index also shows performance much better than SPY for the 2000 to 2003 time period. The performance for XRO vs SPY is shown in the second graph above.

Perhaps I would be better off just buying XRO instead of implementing my approach. The expense ratio for XRO is 0.60%. However, the expense ratio for the Select SPDRs is only 0.24%. My approach involves actively switching among the Select SPDRs so transaction costs are being incurred which must be added to the Select SPDRs expense ratio for comparison. For small position sizes, it would likely be better to just purchase XRO instead of actively switching between the Select SPDRs.

Saturday, November 3, 2007

When a Problem Comes Along, You Must Whip It


Are you sure you want to be a trader? The recent choppy market action might be making you wonder. Dr. Brett's 'Doll Face Trader' post earlier this week raises the question of whether you really want to be a trader or are just attracted to the image of the trader. The post also includes a link to an interesting video.

How do you know what you want to do? Brian Kim published a post last year to help you find what you love to do.

A key part of trading is developing conscientiousness and self-discipline. Dr. Hong published three posts this week on 'Developing Conscientiousness'.

If you still want to be a trader by all means...
   Go Forward, Move Ahead... It's Not Too Late

Monday, October 29, 2007

Best Day of the Month

Since the bottom in 2003, the 1st trade day has been the best day of the month for SPY. The 23rd trade day of the month has been nearly as good. The 11th trade day of the month tends to quite good as well.

The strength early and late in the month is certainly something that can be exploited for a short term trade. Examination of market circumstances near the end of the month and this seasonal bias may yield a a reliable trade that can be added to your arsenal.

The table below shows the results for each trade day of the month. Note that the Nth trade day of the month is the Nth day on which trading occurred during the month. Also note that the 20th through 23rd trade day of the month do not occur in every month.

Sunday, October 28, 2007

Best Day of Week

Seasonality is a factor that can help us to establish advantageous times to enter trades. For example, if we know that Friday tends to be the weakest day of the week we might have a bias to buy on Friday.

Since the bottom in 2003, Friday has indeed been the weakest day of the week for SPY. The SPY has done much better during the first half of the week with Wednesday being the best day. While the average gains are not large enough to justify a trade by themselves, they are useful as an additional tool for trade timing. The figures for each day on a close-to-close basis are listed in the table below.

Saturday, October 27, 2007

Do You Have the Gear To Join My Beloved Corps?


Well... I did not get much done this week. I did not do what I needed to do to be prepared to place a trade or two based on my indicators. I worked on some issues related to trading research, but they were of peripheral importance at this time.

This week, Dr. Brett had a very good post on the four types of problem traders. He points out the key strengths that must be developed to combat each of the problems. I must maintain my focus on these fundamental issues.

Is the drill Sargent approach the way to go? The 'Can Do' attitude of the military should be helpful in maintaining focus. The 'No Excuse Leadership' book about Army Ranger training sounds interesting. I may have to get a copy of the book.

You had best square your a__ away and start s______ me Tiffany cuff links!
   -- Gunnery Sargent Hartman

Sunday, October 21, 2007

The 3x2 System


Another StockPickr system that I follow is the '3x2 System'. The system as disclosed trades all of the Nasdaq-100 index stocks. I only trade 20 stocks from the Nasdaq-100 to reduce the number of trades. The plot above shows the equity curve for the filtered version of the system over the last 3 years.

The system has solid statistics with a win rate of 70% and an average return per trade of 1.6%. The filtered version of the 3x2 produces about the same number of trades as the 'Crash System' I mentioned in yesterdays post.

Each of these systems has good potential. However, they each can experience significant drwadown during open trades. One of the modifications I have made is to limit the time each trade can be open to avoid the occasional big wipeouts that these stocks can experience.

Saturday, October 20, 2007

The QQQQCrash System


There are simple mechanical systems available that have good performance that you may be able to adapt to your personal tastes. For example, the StockPickr 'QQQQCrash with Stocks' system has continued to do well after it was disclosed on 12/31/2006. The plot above shows the equity curve for this system for the past three years.

The system trades all of the Nasdaq-100 stocks so it is involves active trading but not so many trades as to be unworkable. The statistics are very solid with a win rate of about 69% and an average return per trade of about 1%.

Friday, October 19, 2007

20th Anniversary of the Crash of '87


Happy Anniversary! The Dow commemorated the date by dropping 366 points versus the 508 points it dropped on 'Black Monday' 1987. In percentage terms, today's drop was only 2.6% compared to the 22.6% drop in 1987. That certainly provides some perspective on the performance of the stock market over the last 20 years.

As the video above shows, things could be a lot worse.

Sunday, October 14, 2007

It Wasn't Meant to Be a Game!


It Wasn't Meant to Be a Game
Trading is a business. If you are trading for excitement, you would be better off gambling in Las Vegas where they have a floor show and free drinks.

The Game Was Created to Demonstrate
the Futility of Individual Effort
Trading is one of the most difficult professions to master. It seems that the market does whatever is necessary to frustrate the greatest number of participants. Everyone is eventually humbled by the market. Don't agonize about mistakes, learn from the experience.

No Player is Greater Than the Game Itself
When everything is going your way -- watch out! Position sizing and risk management are always important.

Jonathan! Jonathan! Jonathan!

Saturday, October 13, 2007

Intermediate Term Outlook


The first plot above shows where the most recent 65 days of the SPY has reasonable correlation to periods in the past. The red lines mark the times where the current 65 days match the past. As you can see, these times were not very advantageous points to buy SPY.

My 'Intermediate Term Outlook' post in September showed the same type of plot from the September point of view. That plot is the second plot above. The high correlation points since 2003 were just prior to significant moves up, which is what has happened in the last month.

Perhaps examining intermediate term correlations can provide useful perspective about the current market's potential. Caution is advised as the number of samples is very small.

I will be examining sectors and individual stocks with this same approach to see if it is useful as an additional element of my trading approach. I will provide an update in a later post.

Sunday, October 7, 2007

One Thing


What is your 'One Thing'?

Saturday, October 6, 2007

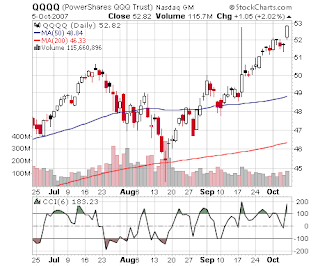
Intermediate Term Timing Using CCI


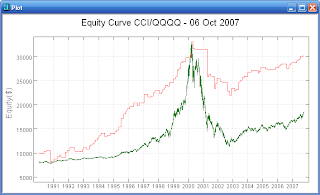
A short period Commodity Channel Index (CCI) can be used as a good intermediate term timing tool. BZBTrader had a post a couple of weeks ago that shows good test results using a six period (end of day) CCI applied to the QQQQs.

BZBTrader discloses the method and provides test output from Trade Station with 'Pyramiding' turned on. The first plot above shows my recreation of the testing on a 'Single Contract' basis. The results are statistically significant and the average win size is large enough to cover expenses. The drawdown can be significant. However, the short trades considered by themselves are not statistically significant and the average win size is very small.

If we test across the entire 17 year history of the QQQQs we see the test results deteriorate to the point of becoming statistically insignificant. (I agree that the most recent several years performance is probably more important.) The equity curve for the entire history of the QQQQs is shown in the second plot above. If we test just the long trades across the entire history of the QQQQs we see that the results are statistically significant and the win size remains relatively large. The third plot above shows the equity curve for the long only trades. Note that the curve is much smoother without the short trades.

What can we conclude from this testing? It seems that the six day CCI can be used as a tool to help us with intermediate term timing. The results for the short only trades are not good. This makes the use of the method for timing short trades questionable. Many thanks to BZBTrader for sharing the methodology! I will be looking further into incorporating the CCI into my trading tool box.

Sunday, September 23, 2007

Feeling Trapped


The recent snap back from the recent panic move down has been very unsatisfying. I did make some long term buys during the pullback, but I did not make a large commitment. The lack of a written plan leaves me with doubts as to what I should have done. I feel trapped by the market no matter what it does. A comprehensive business plan would reduce such feelings. But why am I resistent to creating such a plan? There is nothing stopping me (or you).


The fourth Patriarch was Tao-hsin who attained his own liberation in a famous dialogue. He came to Seng-t'san and asked,
   "What is the method of liberation?"
   "Who binds you?" asked Seng-t'san.
   "No one binds me." said the pupil.
   "Why then", said the master, "do you seek liberation?"
That was enough for Tao-hsin, who in that moment 'saw'.

-- From "Zen a way of life", by Christmas Humphreys


Saturday, September 22, 2007

Excessive Option Profits Revisited


Revisiting index put option selling as mentioned in my 'Caviar Breakfast Everyday' post... The plot above shows the risk profile for 10 October 48 puts on the QQQQs sold naked short. The 48 strike is about 5% out of the money and at the end of the day Friday could be sold for about $0.39. The sale brings in about 5% of the initial margin required so we may make up to about 5% if the options expire out of the money. That is a reasonably good return for one month.

The risk profile shows the profit/loss at various QQQQs prices at expiration (green line) and two weeks prior to expiration (white line). The highlighted area shows the one standard deviation range for the price. As long as the QQQQs only move one standard deviation against us by expiration, we make the maximum profit of $390. If the QQQQs move two standard deviations against us we lose about $1200. If the QQQQs move one standard deviation against us by two weeks prior to expiration, we have an open loss of about $340. The open loss prior to expiration requires us to put up more margin.

We have the potential for substantial profits most of the time. The options in this example will expire value-free about 87% of the time and we will make our maximum profit. The problem is to determine how bad the loses can be. Certainly most of the time all is well, but the price statistics are not normally distributed and disasters will occur more frequently than the normal distribution suggests. However, we are being well compensated for the disasters by the high price of the options.

How do we deal with the occasional disaster? We can just proceed and limit the leverage to avoid being wiped out. We can switch to selling credit spreads to cap our losses in the event of a disaster. We can use market timing to limit out naked selling to periods in which we believe disasters will be less likely. Using credit spreads and/or market timing will limit our profits to some extent.

In summary, I have not reached a conclusion as to whether or not naked index put selling is right for me. I will continue to investigate this approach further. What is your conclusion?

Tuesday, September 18, 2007

The Fed: Smell of Napalm At 2:15


There you have it... the Fed called in a napalm strike this afternoon. The internals were very strong. The number of 20 day highs spiked up to levels not seen since April. (See the plot above.) The number of 20 day lows remains a bit elevated.

If no disaster is revealed in the next few days we could see the SPY at new highs. The big money seems to have commanded a return to 'unstoppable move up' mode.

Sunday, September 16, 2007

The Fed - Which Goblet Contains the Poison?


The scene from "The Princess Bride" in which the dread pirate Roberts challenges the criminal genius Vizzini to a battle of wits clearly illustrates the problems many people get themselves into concerning the Fed's actions. In the scene, Roberts takes the two goblets of wine and adds poison. He then challenges Vizzini to determine which goblet contains the poison. After Vizzini selects, they will then both drink and one will be right and one will be dead. Vizzini considering seemingly all of the possibilities selects the goblet from which he will drink. He also delights in demonstrating his extreme cleverness to Roberts.

The selection process is the same sort of nonsense that occurs prior to each Fed meeting. A post by CXO Advisory shows that during the period around Fed funds rate changes there is no real bias to exploit anyway. The seeming endless speculation on whether the Fed will or will not drop rates by an amount or whether this is fully priced into the market is just a distraction.

At the end of the scene Vizzini dies and we find out that Roberts has poisoned both goblets of wine. He has spent the last few years developing a resistance to the poison so he survives. This illustrates what we should be doing. We should focus on our research, diversification, and position sizing not demonstrating our cleverness in determining the direction of a short term trade that has no edge.

Caviar Breakfast Every Day


The CXO Advisory Blog has a very interesting post on selling index put options. I may have been too quick to dismiss index option selling as too risky. The premiums that the buyers are willing to pay are irrationally high. "For buyers of at-the-money puts to break even, October 1987-like crashes would have to occur 1.3 times per year."

I will be investigating this further. Perhaps if you limit your leverage to reasonable levels, you may be able to confine the drawdowns to something that you can live with.

Saturday, September 15, 2007

Intermediate Term Outlook


Is it possible to extend the idea of examining short term patterns (number of days up/down, percent up/down, etc.) to determine short term direction to a longer time frame? In the plot above the blue line is the closing price of SPY. The green portion is the most recent 65 days of the SPY price data. The red line is the correlation of the most recent price data to the past price data. The plot only shows when the correlation is reasonably high.

The high correlation zones from 2003 to 2007 were good buying opportunities. However, the high correlation zones from 2000 to 2002 were good selling opportunities. This leaves us with no conclusion unless we already have an opinion about the big picture direction of the market. The longer time frame also means that we do not have a significant number of instances from which to make a decision.

Sunday, September 9, 2007

Your Personal Legend


Dr. Brett's excellent post, "When the Trading Dream Dies", captures the Mediocre Trader mindset. After you abandon the big league dream (or more likely the big league fantasy) you will be free to create and pursue a new dream.

Free yourself so you can begin to work on realizing your Personal Legend ("The Alchemist" by Paulo Coelho).

Take a look at the Crazy Sexy Cancer website for some additional perspective.

My name in Inigo Montoya, you killed my father, prepare to die.

Sector Rotation


What about using a simple sector rotation scheme to substitute for SP-500 exposure? The first plot above shows a comparison of such a scheme compared with SPY. The sector rotation did much better during the down market of 2000 to 2002 and did better during the up market of 2003 to 2007.

The results shown are based on the relative strength of the nine Select Sector SPDRs (XLB, XLE, XLF, XLI, XLK, XLP, XLU, XLV, XLY). The bottom three sectors based on 30 day relative strength are purchased and held for 30 days. The results for the top three sectors are much worse in the down market of 2000 to 2002 and a not quite as good as the bottom sectors in the up market of 2003 to 2007.

The relative strength approach is sensitive to the start time of the testing. The second plot above shows the results for the sector rotation with different starting times. All of the starting times produced better results than just holding SPY.

Sector rotation looks promising as a way to increase a portfolio's return without taking on much additional risk. Additional investigation is necessary. For example, most of the transaction costs can be eliminated if we use a single mutual fund or ETF. The Claymore/Zacks Sector Rotation ETF (XRO) and the Rydex Sector Rotation Fund (RYSRX) are available. XRO only has one year of data available and RYSRX only has data from 2002 so we cannot tell if they would have held up as well as the bottom three SPDRs scheme in a significant down market.

I will continue to investigate and provide additional updates on sector rotation in the future. Does anyone know of other sector rotation ETFs or mutual funds?

Wednesday, September 5, 2007

A Player...or Nothing


Wake up, will ya, pal?
If you're not inside, you are outside, OK?
I'm not talking about some $400,000-a-year Wall Street stiff...
...flying first class and being comfortable. I'm talking about liquid.
Rich enough to have your own jet.
Rich enough not to waste time.
Fifty, a hundred million dollars, Buddy.
A player...
...or nothing.


While it may be amusing to think about being a player, everyone cannot be a player. This is especially true for the part time trader. But.. there is an alternative to the nothing that GG mentions above. You can be a Mediocre Trader!

The Mediocre Trader has the interest, research capabilities, discipline, and resources to be far more successful than the uninformed trader. The Mediocre Trader also has a sense of his place in the food chain so that the disasters common to the uninformed trader can be avoided. And if things work out as a Mediocre Trader, you can always become a player later.

So let's become a Mediocre Trader!