
In my prior 'Sector Rotation' post, I described a method that buys the three lowest relative strength Select SPDRs. The equity curve for this approach is shown in the first plot above. The method substantially out performs SPY especially during the big down market of 2000 to 2003.
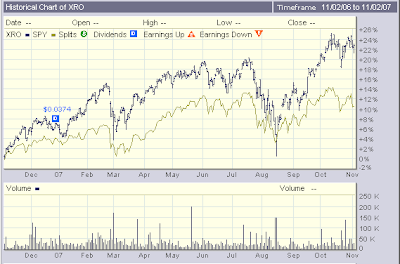
In the prior post I also mentioned the Claymore/Zacks Sector Rotation ETF (XRO). I have since located the fact sheet for XRO. This ETF is based on a proprietary Zacks methodology that selects 100 of the 1000 largest domestic companies/ADRs to hold for the next quarter. The selection process is then repeated each quarter. The fact sheet contains a graph of the index on which XRO is based. The performance of this index looks very similar to the performance I show for my sector rotation method. In particular, the Zacks index also shows performance much better than SPY for the 2000 to 2003 time period. The performance for XRO vs SPY is shown in the second graph above.
Perhaps I would be better off just buying XRO instead of implementing my approach. The expense ratio for XRO is 0.60%. However, the expense ratio for the Select SPDRs is only 0.24%. My approach involves actively switching among the Select SPDRs so transaction costs are being incurred which must be added to the Select SPDRs expense ratio for comparison. For small position sizes, it would likely be better to just purchase XRO instead of actively switching between the Select SPDRs.
No comments:
Post a Comment