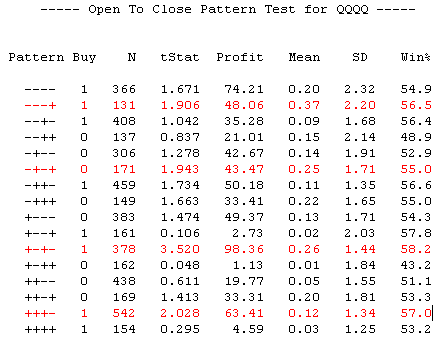
'Day Trading With Short Term Price Patterns & Opening Range Breakout' by Toby Crabel describes many interesting patterns and illustrates his approach to market research. For example, the 'Open to Close' pattern shown in the table above.
The table shows the open to close bias for the QQQQs based on the three prior days' closes and the current day's opening. Whether the three prior days closed up or down is shown by the first three '+' or '-' signs in the Pattern column. The final '+' or '-' shows whether the current day's open is up or down. The Mean column shows the average percent profit entering at the open and exiting at the close. The Buy column contains '1' for a buy and a '0' for a sell. The statistically significant patterns are in red.
Knowledge of such patterns can help you to determine the up or down bias for the day. Applying such patterns to individual stocks will reveal larger percentage biases that might be tradable in isolation. The above pattern combined with other information could form the basis for a short term trading system. I will be reexamining the Crabel approach and will post further on this topic in the future.
No comments:
Post a Comment