Sunday, June 28, 2009
Set Realistic Goals
Obama Drastically Scales Back Goals For America After Visiting Denny's
Make sure your trading goals are realistic for your experience level, skill level, and available capital.
Saturday, June 27, 2009
The New Normal?

The statistics for the broad market indices (daily data) have become stationary for the past year. The plot of SPY above shows the stationarity for a rolling one year, two year, and three year period. When the colored lines are below the critical value (horizontal gray line), the statistics for the corresponding period are stationary. The statistics for the past two years and three years are not stationary. The past year has become the new normal. Will the coming year exhibit the same tendency for monster moves as the last year?

The more volatile emerging markets (EEM) also have stationary statistics for the past year. The statistics for the last two years and three years are not stationary, but are closer to the threshold than SPY. Will emerging markets continue to lead the way?

The long term treasury bonds (TLT) statistics are not stationary for the past one, two, or three year periods. TLT was even more destabilized by the October 2008 market crash than the stock indices. Can there be an economic recovery with instability in the bond markets?
Sunday, June 21, 2009
Shannon Rebalancing Revisited

What if we were to apply the Shannon method to the Permanent Portfolio discussed last week? The Permanent Portfolio used for testing was equal parts of VTI, TLT, SHY, and GLD. The plot above shows the results for the last three years for buy and hold and for Shannon style rebalancing. The rebalancing has helped a little bit since March 2009.

If we add a short SP-500 position (SDS) to the asset mix, the results are of course better as the market has had a rough couple of years. But, notice how much better the Shannon style rebalancing has done compared to buy and hold. This plot above shows the results for the last three years for a portfolio consisting of equal parts TLT, SHY, GLD, and SDS and a double allocation to VTI. Perhaps active rebalancing between an index and a short position in another index is what is need in uncertain times?

The correlations of the portfolio components are listed in the table above. Are there any asset classes that have a negative correlation to the stock market other than bond funds and short funds?
Crisis is Not Over
Deflation is a very real threat.
The mortgage delinquency problem still exists.
TrimTabs says go short.
There is always 2012 (video above).
Sunday, June 14, 2009
Update: Long Term Investment Portfolio

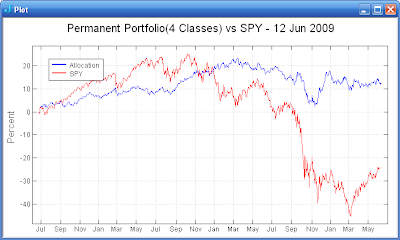
A correction from the prior post -- The original version of the Permanent Portfolio does use just four asset classes (stocks, bonds, gold, cash). The performance for the last three years using equal positions of TLT, SHY, GLD, and VTI is show above. The portfolio works because of the relatively low correlation between the asset classes. (See the table below.)

The Permanent Portfolio Fund (PRPFX) adds four more asset classes to the portfolio (silver, real estate, natural resource stocks, and Swiss Franc). The correlations for eight ETFs representing these asset classes is show in the table above. The additional asset classes do add much in the way of reduced correlation.

The additional asset classes do not modify the performance over the last three years by a large amount. The plot above shows the equity curve for the portfolio using the following ETFs and weightings: TLT/18%, SHY/17%, GLD/20%, SLV/5%, IWM/15%, ICF/8%, IGE/7%, and FXF/10%. The extra asset classes seem to have increased the variability of the portfolio a bit. Addition study will be required to determine if the additional asset classes (implemented with ETFs) are really worthwhile additions to the four class portfolio.
Sunday, June 7, 2009
Long Term Investment Portfolio

What should the composition be of a really long term portfolio? Such a portfolio must be capable of surviving through inflation, deflation, recession, and good times. The Permanent Portfolio, originally proposed by Harry Browne, may be such a portfolio.
A variant of the Permanent Portfolio proposed by CrawlingRoad is even simpler. It consists of long term treasuries, short term treasuries, gold bullion, and US total stock market index. The compound annual growth rate (CAGR) for the Permanent Portfolio from 1972-2008 was 9.79%. The plot above shows the portfolio compared to SPY for the last 3.5 years. The portfolio in the plot above consists of 25% positions in each of TLT, SHY, GLD, and VTI.
The CAGR for the Permanent Portfolio is a bit better than the total stock market index while greatly reducing the devastating drawdowns of the stock market alone. The original Permanent Portfolio also included an allocation to silver, real estate, natural resource stocks, and the Swiss franc. I will more closely examine the original portfolio. Either version of the Permanent Portfolio may be a good approach for the long term core position allocation of your personal portfolio.
Saturday, June 6, 2009
Soldier of Fortune

Can you rent a trading method from someone else and be successful? Suppose you subscribe to a proprietary trading signal, will you have sufficient confidence in the methodology to follow the signals? Some of the subscription services certainly have good records. If your own methodology can not match the reliability/return/statistics of the following services, would you be better off renting a methodology from one of these services?
Vertical Solutions: S&P 500 futures $250/month
MarketSci: YK Strategy - S&P 500 and Russell 2000 $100/Month
QuantifiableEdges: Variety of Analysis and Trade setups $75/month
Subscribe to:
Comments (Atom)