Saturday, February 28, 2009

Market Filter


What should be used as the triggering mechanism to take defensive action in your asset allocation plan or trading scheme? The 200 day moving average is a very simple and widely used way to signal that defensive action should be taken. (See the first plot above). On the move up from 2003-2007, the market made regular retreats below the 200 day moving average. If a more sophisticated criteria had been used, perhaps we could have recognized these retreats as normal pullbacks instead of potential crashes. (The slope of the 200 day moving average could be used as a signal to avoid such problems.)

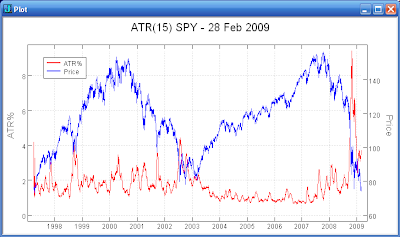
The average true range expressed as a percentage of the current closing price might be useful in detecting abnormal market conditions. (See the second plot above.) In particular, the low volatility from 2003-2007 signaled that the pullbacks were not the beginnings of a market crash. The increasing ATR levels in 2007 and 2008 foreshadowed the crash at the end of 2008. The extreme ATR levels have currently backed off to the quite high levels reached during the 2000-2003 bear market. Is the high volatility a sign that it is still too early to be considering long term buys?

Sunday, February 22, 2009

Update: Shannon Method / Rebalancing


The Shannon Method of rapid rebalancing has some potential to capture some of the random fluctuations in stock prices. I have pursued combining a small number of relatively uncorrelated stocks in a portfolio and rebalancing them as they move 3% from the prior rebalance point. See my August 2008 post for a more detailed explanation of the Shannon method.

The plot above shows the results for a portfolio starting with four stocks (GG, MSFT, O, VLO) weighted 20% each and a 20% cash position. (See prior post.) The rebalancing lagged as the market surged up, but held up better during the crash. The rebalancing has been successfully capitalizing on the market's recent choppy action since late 2008. The rebalanced portfolio is currently holding about $15,000 cash versus $5,000 cash for the buy and hold portfolio.

Thursday, February 19, 2009

Any Hope?

Is there any hope for the beginnings of an economic turn around?

Copper has moved up a bit off of the bottom.


The Manheim Used Vehicle Index made a move up in January.


The Baltic Dry Shipping Index has been moving up so far this year.

Thursday, February 12, 2009

Sunday, February 8, 2009

Money, Money, Money


Money, Money, Money
Always Sunny in the Rich Man's World

Saturday, February 7, 2009

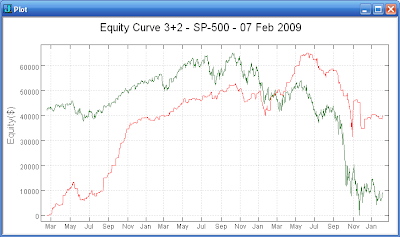
Update: 3x2 System and Crash System


The 'Crash System' continues to recover from the end of 2008 market crash. The equity curve is closing in on the equity high reached in September 2008.


The '3x2 System' equity curve has continued to chop sideways after the end of 2008 market crash. The equity curve is up off of the bottom, but has not made a convincing move up.

A diversified portfolio of active trading methods will likely be the best approach for the volatile doom prone market we may be facing for years.

Sunday, February 1, 2009

Buy and Hold Dead?


The stock market has gone nowhere to down for the last 10 years. The chart above shows US large capitalization (SPY), US small capitalization (IWM), US REITs (ICF), and foreign large capitalization (EFA) for the past 10 years. Your passive equity index allocation has not done anything worthwhile for a very long time. The current bear market has show the potential value of at least adding a tactical component to your asset allocation scheme.