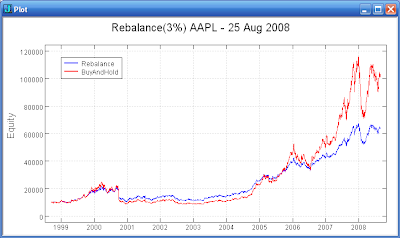


The Shannon method of frequent rebalancing (50/50) between a stock and cash allows you to capture some of the volatility of the stock. CASTrader had a post on 'The Shannon Method ' a couple of years ago. In the plots above I have rebalanced between the indicated stock and cash when ever the stock price has changed by 3% on a closing basis since the last rebalance point.
The plot of MSFT illustrates that you might experience out performance on a total return basis with rebalancing. The plot of AAPL illustrates that you easily may experience total return under performance quite a bit of the time while rebalancing. The JNJ plot illustrates that a lower volatility stock has less potential for the rebalancing to vary from buy and hold.
The main point that CASTrader makes is the internal rate of return will generally be higher for the rebalanced case. A high internal rate of return is only helpful if we have some place to reinvest our profits from the stock sales. Applying this approach to a set of stocks potentially allows us to move profit from one stock to another that has pulled back and will shortly be experiencing a high rate of return.
A set of suitable stocks that are relatively uncorrelated is need for this approach to work. I will be testing with various sets of stocks to see if it is possible to out perform a buy-and-hold approach with the same stocks. I will be following the CAStrader method of rebalancing the stocks positions as if a 50% cash position were being maintained, but will be working with a smaller common cash pool.
No comments:
Post a Comment