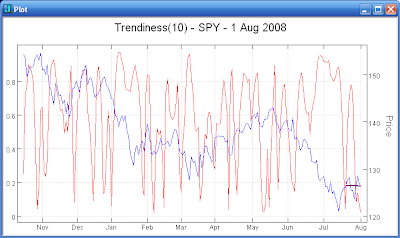


Has the market been choppy enough for you? On a ten day basis, SPY has demonstrated a near perfect lack of trend. See the first plot above. The purple line is the linear regression line of the SPY close for the past ten days. The market has gone sideways but has made noticeable excursions up and down over the last ten days.
From a longer 30 day perspective, we can see that SPY is moving from a very trendy down move into a potential low trendiness chop. See the second plot above. Notice that the market does not remain in very low trendiness state for very long. We may be approaching another potential deflection point.
No comments:
Post a Comment