Sunday, November 30, 2008

Memento Mori


Time grows short...

Like many people (unless you are very young), I have lost too much in my long term accounts during the market crash. Asset allocation works very well under more usual circumstances, but does not help during a crash. Action must be taken at some predetermined trigger point. The action may be establishing a hedge or just reducing exposure by selling positions. Consolidating assets into fewer accounts should help make the need for action even more obvious.

The current Scientific American Mind contains an interesting article on procrastination and how to avoid making it a habit.

Is resveratrol the key to aging? Is it a part of 'The Horizon'? (ref. Rambaldi) <o>

Update: Simple Mechanical System


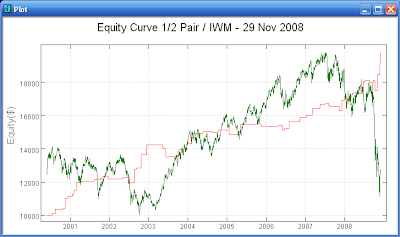
The simple mechanical system I described back in August has avoided disaster during the recent market crash. Take a look at the equity curve above. The system trades IWM and produces similar results for the both the long and short sides. Coupled with a reasonable position sizing/risk management approach, the method might be usable as a base for an automated trading approach.

Saturday, November 29, 2008

Update: Half Pair Trading


The Half Pair/Unilateral Pairs trading concept continued to do well during the recent market crash. IWM trading based on the IWM/SPY ratio managed to be on the right side of the market during the crash. The equity curve plot and the current plot of the IWM/SPY ratio (red) are included above. The ratio plot includes the moving average of the ratio (green) and the number of standard deviations the ratio is above or below the moving average (purple).

This concept still seems to be very powerful. The only problem is to find a number of pairs that are working in the current environment.

Saturday, November 22, 2008

Thanksgiving Trade


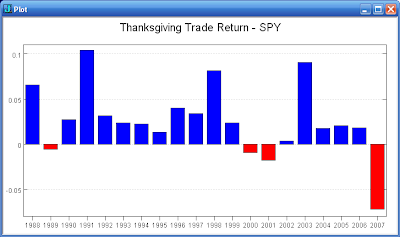
I am a bit late posting about the Thanksgiving trade which buys the market the week prior to Thanksgiving and exits the market in the third week of January. (This may have been fortuitous as entering on November 19 would currently put the trade 2.5% under water.)

Over the last 20 years, the trade has been a winner 80% of the time with an average return of 2.6% per trade. The standard deviation was 4% and the win/loss ratio was 1.5. A chart of the equity curve and a bar chart of the return for each of the last 20 years is included above. The method has been reliable with only small losers with the notable exception of 2007 where the trade lost 7.2%. 2003 was a recent big winner returning 9.1%. In light of the devastating market plunge the past two months, can we dare to hope for a year end rally?

Wednesday, November 19, 2008

Time for a Maverick Move?


First the October crash and snap back rally. Then the November crash to new lows. The various government bailouts are not helping and major bankruptcies are looming in the near future. Volatility remains extremely high and nothing except treasuries are working on the long side. Is it time for a maverick move? Are we so doomed that it is time to buy (at least for a trade)? Or, are we in such a precarious position that the real cascade down is about to begin?

Sunday, November 16, 2008

3x2 Method Crash


The 3x2 method succumbed to the October crash. The method had been doing extremely well into late September having moved back to near the prior equity high. A good illustration of the lesson that any method needs a risk control overlay that reduces exposure as market volatility becomes extreme.

Friday, November 14, 2008

Consumerism Dead?


There has been a BIG drop in retail sales. Circuit City has filed for bankruptcy protection. Best Buy has cut its earnings forecast amid the 'most difficult climate' in its history. Citigroup has announced massive layoffs and an increase in credit card interest rates. Will consumer behavior be changed over the long term? If there is such a change, is there any hope for the economy and the stock market? A substantial portion of the economy is based on morons continuing to buy over priced junk.

Monday, November 10, 2008

Copper


Copper prices may be trying to stabilize. If copper can start to go back up, perhaps we will begin to see the early stages of a stock market recovery.

Saturday, November 8, 2008

Used Vehicle Prices Falling


The Manheim Used Vehicle Value Index took a big hit in October. We have not yet reached the lows seen in early 2003. A continued rapid drop will eventually lead to a reversal which will an early indication of increasing consumer sentiment.

Sunday, November 2, 2008

Green Acres


Are the agricultural commodities (DBA) a buy after the commodities collapse? DBA contains equal parts corn, wheat, soybeans, and sugar. DBA seems to be attempting to stabilize over the last few weeks. The October 24th edition of the Commitment of Traders Report shows the commercials at a 12 month high for corn, wheat, and soybean contracts. There should eventually be renewed interest in these commodities. Aren't some ethanol producers still in business?

Saturday, November 1, 2008

Short Term Correlations


The short term correlation between the SP-500 (SPY) and long term treasuries (TLT) has moved back up toward the top of its recent range. We may be near an inflection point. Will money move back into treasuries or continue to move into stocks? (The plots show the 20 day rolling correlation of the two indicated assets.)


The correlation between the SP-500 (SPY) and treasury inflation protected bonds (TIP) has continued to increase toward zero as the TIP price has plunged. Is this a TIP buying opportunity? The correlation has not been this close to zero since October 2007 where TIP rallied.


The correlation between the SP-500 (SPY) and commodities (DBC) has gone unusually positive from an unusually negative level back in July. Is this a big picture buy signal for DBC as it is usually not so highly correlated to the stock market? If the stock market continues to rally can commodities stabilize?


The correlation between the SP-500 (SPY) and gold (GLD) has recently spiked toward zero. Can gold move to back to a significant negative correlation if the stock market pulls back from here?