Tuesday, November 27, 2007
Lobotomy
Well... has the market sustained enough damage to worry you? Is this an opportune time to buy some of the destroyed sectors for the long term? Are you so worried about potential problems that a lobotomy will be required for you to buy? Have you lost faith in short/intermediate term rallies?
Guess I've got to break the news, that I got no mind to lose.
Sunday, November 25, 2007
Don't Wanna Be a Pinhead No More

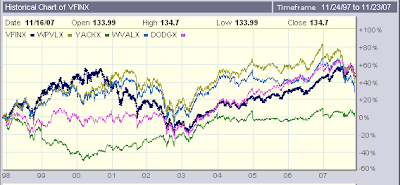
Is this the time to consider buying value? A recent article about buying value funds while they are down makes a good point. This type of fund has the capability to move independently of the market. Take a look at the chart included above. The value funds mentioned in the article (WPVLX, YACKX, WVALX, and DODGX) have sometimes significantly zigged while the market (VFINX) has zagged.
Gabba Gabba Hey
Tuesday, November 20, 2007
Big Picture Outlook

Speaking of the Telechart T2108 indicator...
The T2108 indicator shows the percentage of stocks above their 40 day moving average. When it is below 20% it tends to mark big picture buying opportunities. Take a look at the plot above. The red lines indicate when the T2108 was less than 20%. These times have mostly been good times to buy for the long term. There have been exceptions, such as in late 2001 when the market continued to drop substantially for another year. So as always, caution and reasonable expectations are advised.
Monday, November 19, 2007
The Thanksgiving Trade


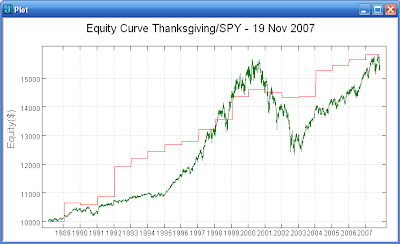
The 'Thanksgiving Trade' has been quite reliable over the years. The trade buys prior to Thanksgiving and sells the third week of January. Over the 19 year history of the SPY, the trade has been a winner 84% of the time with an average return of 3%. The equity curve for the trade and a bar chart of the return for each year is included above.
Will the trade produce a cornucopia of profits this year or will it prove to be a loser like in 2001 and 2002? Even when the trade has been a loser, the losses have been small resulting in a win/loss ratio of 3.5.
Sunday, November 18, 2007
January Effect


January is fast approaching which brings up the question of whether the 'January Effect' exists in recent market history. Do the small capitalization stocks outperform large capitalization stocks during January?
In the last 16 years, the Russell-2000 has been up 81% of the time during January returning an average of 2.5%. The three losing years were 2002, 2003, and 2005. The SP-500, in the last 16 years, has only been up 69% of the time in January and returned an average of 1.2%. The five losing years were 1992, 2000, 2002, 2003, and 2005. The equity curves are shown above.
Can we conclude anything from the above? The results for Russell-2000 vs. SP-500 are not statistically significant. As you can see from the bar chart above, the difference between RUT-X returns and SP-500 returns has not been consistently positive. Examining additional data may show the difference to be significant, but recent history does not seem to show a small capitalization bias.
The results could very well be much different if I had tested with a micro-cap index instead of the small-cap Russell-2000 index. I do not not enough micro-cap data to do any testing. I will have to attempt to find a micro-cap vs. large-cap study for recent years.
Monday, November 12, 2007
Oh the Humanity!

Does the market look bad enough to buy for a short term trade? The VIX is extended to the upside. The beaten down financials attempted a rally today. The unstoppable momentum stocks like AAPL, RIMM, PCU, BHP, and FXI have been stopped.
Is there a short term edge to buying after a decline? The SPY is down four days in a row today. That has only happened 103 times in the 19 year history of SPY. Buying SPY after it has been down four days in a row and holding for five days has returned 1.29% on average. The results for holding one, two, and five days are summarized in the table above.
In 2007, there have been two other instances of SPY being down four days in a row. Holding SPY for five days after 9/25 yielded 1.8%. However, holding SPY for five days after 2/26 resulted in a loss of 5.4%. So even though the bias is to the upside, caution is advised.
Sunday, November 11, 2007
Arugamama
Procrastination is definitely an item I need to work on. The Japanese use the term arugamama to describe the state of "accepting things as they are." This can be the key to overcoming procrastination. Gregg Krech of the ToDo Institute describes the use of Morita Therapy as a resource to overcome procrastination.
One of the key tenets of Morita Therapy is that our thoughts and feelings are uncontrollable by our will. The reasons for procrastination have to do with internal barriers like fear, anxiety, indecision, and perfectionism. The best strategy for coping with fear is to accept it. Don't try to fight it, understand it, or conquer it. And the way to master this strategy for coping with fear is to practice.
"Give up on yourself. Begin taking action now, while being neurotic or imperfect, or a procrastinator or unhealthy or lazy or any other label by which you inaccurately describe yourself. Go ahead and be the best imperfect person you can be and get started on those things you want to accomplish before you die."
- Shoma Morita, M.D.
The video above is Noriyuki "Pat" Morita as Mr. Miyagi in the Karate Kid movies.
Thursday, November 8, 2007
Money For Nothing
That ain't working
That's the way you do it
Money for nothing
And your chicks for free
-- Dire Straits
Are you still convinced that trading is the way to go? Has the market been volatile enough for you? Is the study and analysis of the market still interesting?
Trading must not be work if you are really going to commit the needed time and effort.
Sunday, November 4, 2007
Sector Rotation Again


In my prior 'Sector Rotation' post, I described a method that buys the three lowest relative strength Select SPDRs. The equity curve for this approach is shown in the first plot above. The method substantially out performs SPY especially during the big down market of 2000 to 2003.
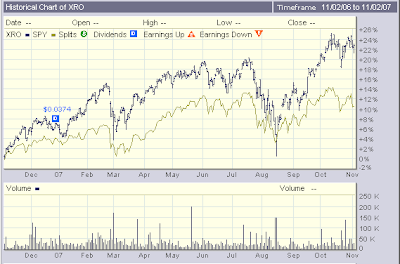
In the prior post I also mentioned the Claymore/Zacks Sector Rotation ETF (XRO). I have since located the fact sheet for XRO. This ETF is based on a proprietary Zacks methodology that selects 100 of the 1000 largest domestic companies/ADRs to hold for the next quarter. The selection process is then repeated each quarter. The fact sheet contains a graph of the index on which XRO is based. The performance of this index looks very similar to the performance I show for my sector rotation method. In particular, the Zacks index also shows performance much better than SPY for the 2000 to 2003 time period. The performance for XRO vs SPY is shown in the second graph above.
Perhaps I would be better off just buying XRO instead of implementing my approach. The expense ratio for XRO is 0.60%. However, the expense ratio for the Select SPDRs is only 0.24%. My approach involves actively switching among the Select SPDRs so transaction costs are being incurred which must be added to the Select SPDRs expense ratio for comparison. For small position sizes, it would likely be better to just purchase XRO instead of actively switching between the Select SPDRs.
Saturday, November 3, 2007
When a Problem Comes Along, You Must Whip It
Are you sure you want to be a trader? The recent choppy market action might be making you wonder. Dr. Brett's 'Doll Face Trader' post earlier this week raises the question of whether you really want to be a trader or are just attracted to the image of the trader. The post also includes a link to an interesting video.
How do you know what you want to do? Brian Kim published a post last year to help you find what you love to do.
A key part of trading is developing conscientiousness and self-discipline. Dr. Hong published three posts this week on 'Developing Conscientiousness'.
If you still want to be a trader by all means...
Go Forward, Move Ahead... It's Not Too Late
Subscribe to:
Comments (Atom)