Sunday, October 26, 2008

Alternate Asset Classes


There are very few alternate asset classes that have worked over the past year. Total return/hedged equity funds (HSGFX) are down moderately over the past year. Risk arbitrage funds (MERFX, ARBFX) are also down moderately. Long only commodity funds (DBC) soared into mid-year, but have since collapsed. The carry trade (DBV) went from modest losses at mid-year to big losses recently. One thing which seems to be working is managed futures (RYMFX). Take a look at the chart above to see a comparison of the mentioned funds over the past year.

Saturday, October 25, 2008

Diversification


The recent market doom makes diversification difficult as all of the various asset classes have tended to become highly correlated. Perhaps expanding into wagering on thoroughbred racing is a way to go. The data analysis task is very similar to stock trading analysis and the outcome of the races should not be correlated at all to the stock market. Wagering also has the advantage that it is not influenced by news or political actions. It is just a matter of acquiring data and finding a place to wager over the Internet.

Sunday, October 19, 2008

International Intrigue


For the past month there was a large spread between the best and worst performing international market The Malaysian stock market (EWM) has outperformed the other 27 markets in the list above. Russia (RSX) comes in last as it did last month. In my post one month ago, we saw Russia (RSX) and Brazil (EWZ) at the bottom of the list and they have have maintained their poor performance through the following month. Spain (EWP) and Switzerland (EWL) were at the top of the list last month and have maintained their positions toward the top of the list in the most recent month. I will have to do some testing to see if there is reasonable potential rotating into the top few markets each period. (And, perhaps shorting the bottom few markets.)

Wednesday, October 15, 2008

Knock Out!


Knock out! The market is down!

Monday, October 13, 2008

Light At the End of the Tunnel?


There was a monster stock rally today (11%) and the VIX actually pulled back from 70 to 55! Can we see the light at the end of the tunnel or is it just an approaching train? Taking a look at the Dow-Jones Industrials, what has happened after a single day rally of 7% or more? The table above summarizes the results for the close one, two, five, and ten days after purchase. There does not seem to be any real bias up or down over the periods examined. The two day hold returns an average of 1.56%, but it is not quite statistically significant. The variability of the results is high and there have been very good and very bad results in the past. Be careful out there.

Saturday, October 11, 2008

A New Hope?


Is there any hope for the market? The Friday late day rally off of the lows was encouraging. Several areas such as small capitalization stocks (IWM +5%), REITs (ICF +11%), and financials (XLF +10%) did very well. However, the VIX closed at 70 up another 9% on the day. Can a rally survive more than a few hours without a substantial decrease in volatility?

Thursday, October 9, 2008

Fear Factor


The stock market crash continues and the fear grows. The VIX is now over 60 and has not been this high since the crash of 1987. See the charts above. There does not appear to be any rally potential until the volatility begins to decrease. Conditions are treacherous and there are few (if any) examples of similar situations.

This could be a major long term buying opportunity. Which is your greatest fear? Not preparing a plan to take advantage of the opportunity, or losing additional money?

Monday, October 6, 2008

Market in Flames - T2108


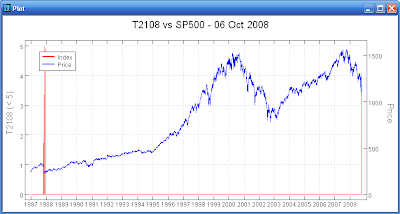
The TeleChart T2108 indicator is now at the lowest level since the period around the October 1987 crash. T2108 is the percent of stocks above their 40 day moving average. We are at a value 4.06 this evening. The lowest value was 0.47 on October 20, 1987. See the plots above. Prior T2108 posts here and here.

Sunday, October 5, 2008

Time for a Trip to the Junkyard?


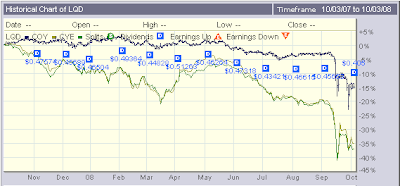
The credit crisis has hit bond funds hard. Even investment grade corporates (LQD) have spiked lower in the last few weeks. LQD is yielding 5.5% and is selling at a small discount to NAV. Junk bonds (COY, CYE) are yielding 14-15% and are selling at a 20% discount to NAV. (See the chart above.)


The COY/LQD ratio is below the level of six years ago. (See the red line on the chart above.) Are we approaching the time to begin buying junk bond funds? The junk bond funds have a higher correlation to the stock market than to the investment grade bond market. When the markets begin to stabilize, junk bonds will greatly out perform the investment grade bonds. Note the move up in COY/LQD from 2002-2003 in the chart above. Is a yield of 15% and a discount of 20% enough compensation for the risk of beginning to buy now? Or, is the better course to begin buying the investment grade bonds?

Dollar Strength


The US dollar is the place to have been over the past few months (see chart above). The dollar (UUP) has made a nice move up since July, while most currencies (FXA, FXE, FXF) and gold (GLD) have declined. The Yen (FXE) has managed to stay unchanged. Silver (SLV) and commodities (DBC) have collapsed.

The 'Bailout' bill being signed into law has not helped the stock market or the credit market yet. Are emergency Fed rate cuts on the horizon? Will the US dollar continue to demonstrate strength? Are we looking at a deflationary scenario?