Monday, August 25, 2008

Shannon Method / Rebalancing


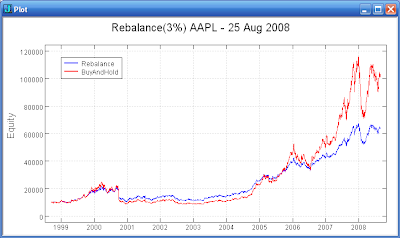
The Shannon method of frequent rebalancing (50/50) between a stock and cash allows you to capture some of the volatility of the stock. CASTrader had a post on 'The Shannon Method ' a couple of years ago. In the plots above I have rebalanced between the indicated stock and cash when ever the stock price has changed by 3% on a closing basis since the last rebalance point.

The plot of MSFT illustrates that you might experience out performance on a total return basis with rebalancing. The plot of AAPL illustrates that you easily may experience total return under performance quite a bit of the time while rebalancing. The JNJ plot illustrates that a lower volatility stock has less potential for the rebalancing to vary from buy and hold.

The main point that CASTrader makes is the internal rate of return will generally be higher for the rebalanced case. A high internal rate of return is only helpful if we have some place to reinvest our profits from the stock sales. Applying this approach to a set of stocks potentially allows us to move profit from one stock to another that has pulled back and will shortly be experiencing a high rate of return.

A set of suitable stocks that are relatively uncorrelated is need for this approach to work. I will be testing with various sets of stocks to see if it is possible to out perform a buy-and-hold approach with the same stocks. I will be following the CAStrader method of rebalancing the stocks positions as if a 50% cash position were being maintained, but will be working with a smaller common cash pool.

Monday, August 18, 2008

The Benjamins


The recent surge up in the dollar has occurred as gold and commodities have plummeted. The first plot above shows the 65 day rolling correlation between gold (GLD) and the dollar index (DXY). The correlation is currently substantially negative. Note that when the correlation has been positive it has tended to mark pullbacks or consolidations in gold.

The second plot above shows the 65 day rolling correlation between a commodity fund (DBC) and the dollar index (DXY). The correlation has moved negatively during the dollar surge. Also notice that the correlation is relatively low compared to that of gold and the dollar.

Is the recent dollar strength enough to end the commodities bull market? Will the straight down decline of the commodities lead to yet another move up? Can short period correlations actually tell us anything?

Tuesday, August 12, 2008

Grail Quest


I really need to focus on some sort of project. What should it be? A Grail Quest! (Or at least some links related to the quest.)

A real life Indiana Jones grail quest.

Project Liberation.

Stop doing what you don't have to do.

Freemasonry and the search for the grail.

The alchemical approach to the quest.

Sunday, August 10, 2008

Asset Class Rotation


A semi-active approach to asset allocation may be the way to go. WorldBeta points out the advantages of a simple asset class rotation approach. The data for the last 30 years shows a substantial increase in return and a reduced drawdown with a modest increase in volatility. WorldBeta describes buying the top 3 of 5 asset classes on a relative strength basis. The top 3 asset classes are selected each month. The asset classes used were US Stocks, foreign stocks, US REITS, US Bonds, and commodities. The first plot above shows the results for this approach over the last 11 years. The return was a bit better than the SPY over the period, and the return was more steady. The second plot shows the results for the last 5 years. The asset rotation had a much better return than SPY.


Adding more asset classes may improve results. For example, the plot above shows the results for the last 3 1/2 years using 4 of 8 asset classes. The return was substantially better than SPY. The asset classes in this case were actual ETFs (AGG, EEM, EFA, IWM, IYR, SPY, and TIP) and one commodity index (DJAIG).

CXOAdvisory reviewed an Asset Class Momentum Trading Strategy and found even better results than WorldBeta. This approach is described in detail at Class Outperformance Investment Strategy. This approach uses 50+ asset classes and selects the 8 or 15 top relative strength asset classes each month. Selecting 8 classes allows for higher returns and volatility equivalent to the S&P 500 while selecting 15 classes reduces the return a bit but also reduces the volatility to less than the S&P 500.

This looks to be a highly effective investment method for long term accounts. I will have to see if I can locate enough data (Yahoo?) to back test 50 asset classes over a substantial time period.

Wednesday, August 6, 2008

Simple Mechanical System


BZB Trader has been posting test results for some simple mechanical trading systems. Some of these systems can produce fairly good results and might be a good starting point for designing your own system.

For example, take a look at the plot included above. This equity curve was produced by a variation of the 'Grand Slam Cross' system. While trading IWM, this system returned 0.5% per trade with a 72% win rate and a 0.9 win/loss ratio. The system is very interesting in that it has been produced good results on the short side. While the system has produced very steady results since 2005, it did not do well from mid-2003 through 2004.

Sunday, August 3, 2008

Roller Coaster


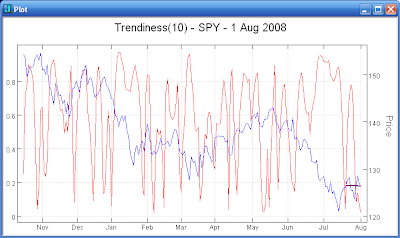
Has the market been choppy enough for you? On a ten day basis, SPY has demonstrated a near perfect lack of trend. See the first plot above. The purple line is the linear regression line of the SPY close for the past ten days. The market has gone sideways but has made noticeable excursions up and down over the last ten days.

From a longer 30 day perspective, we can see that SPY is moving from a very trendy down move into a potential low trendiness chop. See the second plot above. Notice that the market does not remain in very low trendiness state for very long. We may be approaching another potential deflection point.