Monday, October 29, 2007

Best Day of the Month

Since the bottom in 2003, the 1st trade day has been the best day of the month for SPY. The 23rd trade day of the month has been nearly as good. The 11th trade day of the month tends to quite good as well.

The strength early and late in the month is certainly something that can be exploited for a short term trade. Examination of market circumstances near the end of the month and this seasonal bias may yield a a reliable trade that can be added to your arsenal.

The table below shows the results for each trade day of the month. Note that the Nth trade day of the month is the Nth day on which trading occurred during the month. Also note that the 20th through 23rd trade day of the month do not occur in every month.

Sunday, October 28, 2007

Best Day of Week

Seasonality is a factor that can help us to establish advantageous times to enter trades. For example, if we know that Friday tends to be the weakest day of the week we might have a bias to buy on Friday.

Since the bottom in 2003, Friday has indeed been the weakest day of the week for SPY. The SPY has done much better during the first half of the week with Wednesday being the best day. While the average gains are not large enough to justify a trade by themselves, they are useful as an additional tool for trade timing. The figures for each day on a close-to-close basis are listed in the table below.

Saturday, October 27, 2007

Do You Have the Gear To Join My Beloved Corps?


Well... I did not get much done this week. I did not do what I needed to do to be prepared to place a trade or two based on my indicators. I worked on some issues related to trading research, but they were of peripheral importance at this time.

This week, Dr. Brett had a very good post on the four types of problem traders. He points out the key strengths that must be developed to combat each of the problems. I must maintain my focus on these fundamental issues.

Is the drill Sargent approach the way to go? The 'Can Do' attitude of the military should be helpful in maintaining focus. The 'No Excuse Leadership' book about Army Ranger training sounds interesting. I may have to get a copy of the book.

You had best square your a__ away and start s______ me Tiffany cuff links!
   -- Gunnery Sargent Hartman

Sunday, October 21, 2007

The 3x2 System


Another StockPickr system that I follow is the '3x2 System'. The system as disclosed trades all of the Nasdaq-100 index stocks. I only trade 20 stocks from the Nasdaq-100 to reduce the number of trades. The plot above shows the equity curve for the filtered version of the system over the last 3 years.

The system has solid statistics with a win rate of 70% and an average return per trade of 1.6%. The filtered version of the 3x2 produces about the same number of trades as the 'Crash System' I mentioned in yesterdays post.

Each of these systems has good potential. However, they each can experience significant drwadown during open trades. One of the modifications I have made is to limit the time each trade can be open to avoid the occasional big wipeouts that these stocks can experience.

Saturday, October 20, 2007

The QQQQCrash System


There are simple mechanical systems available that have good performance that you may be able to adapt to your personal tastes. For example, the StockPickr 'QQQQCrash with Stocks' system has continued to do well after it was disclosed on 12/31/2006. The plot above shows the equity curve for this system for the past three years.

The system trades all of the Nasdaq-100 stocks so it is involves active trading but not so many trades as to be unworkable. The statistics are very solid with a win rate of about 69% and an average return per trade of about 1%.

Friday, October 19, 2007

20th Anniversary of the Crash of '87


Happy Anniversary! The Dow commemorated the date by dropping 366 points versus the 508 points it dropped on 'Black Monday' 1987. In percentage terms, today's drop was only 2.6% compared to the 22.6% drop in 1987. That certainly provides some perspective on the performance of the stock market over the last 20 years.

As the video above shows, things could be a lot worse.

Sunday, October 14, 2007

It Wasn't Meant to Be a Game!


It Wasn't Meant to Be a Game
Trading is a business. If you are trading for excitement, you would be better off gambling in Las Vegas where they have a floor show and free drinks.

The Game Was Created to Demonstrate
the Futility of Individual Effort
Trading is one of the most difficult professions to master. It seems that the market does whatever is necessary to frustrate the greatest number of participants. Everyone is eventually humbled by the market. Don't agonize about mistakes, learn from the experience.

No Player is Greater Than the Game Itself
When everything is going your way -- watch out! Position sizing and risk management are always important.

Jonathan! Jonathan! Jonathan!

Saturday, October 13, 2007

Intermediate Term Outlook


The first plot above shows where the most recent 65 days of the SPY has reasonable correlation to periods in the past. The red lines mark the times where the current 65 days match the past. As you can see, these times were not very advantageous points to buy SPY.

My 'Intermediate Term Outlook' post in September showed the same type of plot from the September point of view. That plot is the second plot above. The high correlation points since 2003 were just prior to significant moves up, which is what has happened in the last month.

Perhaps examining intermediate term correlations can provide useful perspective about the current market's potential. Caution is advised as the number of samples is very small.

I will be examining sectors and individual stocks with this same approach to see if it is useful as an additional element of my trading approach. I will provide an update in a later post.

Sunday, October 7, 2007

One Thing


What is your 'One Thing'?

Saturday, October 6, 2007

Intermediate Term Timing Using CCI


A short period Commodity Channel Index (CCI) can be used as a good intermediate term timing tool. BZBTrader had a post a couple of weeks ago that shows good test results using a six period (end of day) CCI applied to the QQQQs.

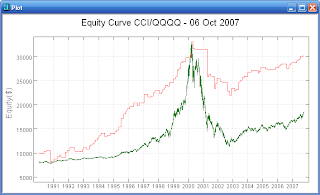
BZBTrader discloses the method and provides test output from Trade Station with 'Pyramiding' turned on. The first plot above shows my recreation of the testing on a 'Single Contract' basis. The results are statistically significant and the average win size is large enough to cover expenses. The drawdown can be significant. However, the short trades considered by themselves are not statistically significant and the average win size is very small.

If we test across the entire 17 year history of the QQQQs we see the test results deteriorate to the point of becoming statistically insignificant. (I agree that the most recent several years performance is probably more important.) The equity curve for the entire history of the QQQQs is shown in the second plot above. If we test just the long trades across the entire history of the QQQQs we see that the results are statistically significant and the win size remains relatively large. The third plot above shows the equity curve for the long only trades. Note that the curve is much smoother without the short trades.

What can we conclude from this testing? It seems that the six day CCI can be used as a tool to help us with intermediate term timing. The results for the short only trades are not good. This makes the use of the method for timing short trades questionable. Many thanks to BZBTrader for sharing the methodology! I will be looking further into incorporating the CCI into my trading tool box.